Our Favorite Business Strategy Frameworks
6 Tools Every Business Consultant Should Kno
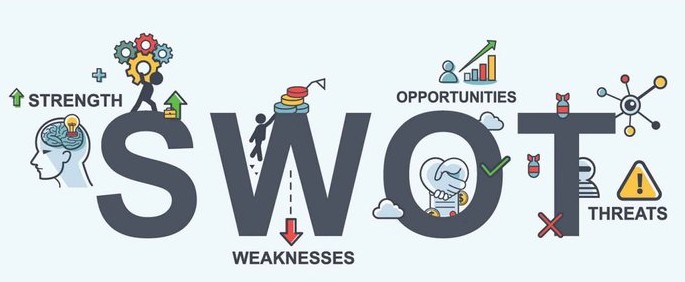
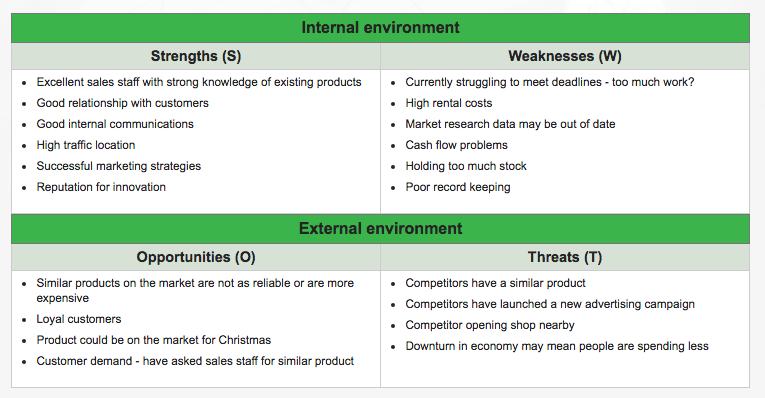
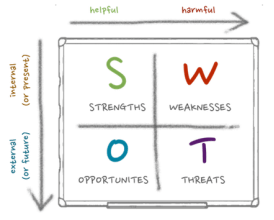
SWOT analysis (or SWOT matrix) is a strategic planning technique used to help a person or organization identify the Strengths, Weaknesses, Opportunities, and Threats related to business competition or project planning. It is intended to specify the objectives of the business venture or project and identify the internal and external factors that are favorable and unfavorable to achieving those objectives. Users of a SWOT analysis often ask and answer questions to generate meaningful information for each category to make the tool useful and identify their competitive advantage.
Strengths and Weakness are frequently internally-related, while Opportunities and Threats commonly focus on environmental placement.
- Strengths: characteristics of the business or project that give it an advantage over others
- Weaknesses: characteristics of the business that place the business or project at a disadvantage relative to others
- Opportunities: elements in the environment that the business or project could exploit to its advantage
- Threats: elements in the environment that could cause trouble for the business or project
The degree to which the internal environment of the firm matches with the external environment is expressed by the concept of strategic fit. Identification of SWOTs is important because they can inform later steps in planning to achieve the objective. First, decision-makers should consider whether the objective is attainable, given the SWOTs. If the objective is not attainable, they must select a different objective and repeat the process.
Some authors credit SWOT to Albert Humphrey, who led a convention at the Stanford Research Institute (now SRI International) in the 1960s and 1970s using data from Fortune 500 companies. However, Humphrey himself did not claim the creation of SWOT, and the origins remain obscure.
Porter's Five Forces Framework is a tool for analyzing competition of a business. It draws from industrial organization (IO) economics to derive five forces that determine the competitive intensity and, therefore, the attractiveness (or lack of it) of an industry in terms of its profitability. An "unattractive" industry is one in which the effect of these five forces reduces overall profitability. The most unattractive industry would be one approaching "pure competition", in which available profits for all firms are driven to normal profit levels. The five-forces perspective is associated with its originator, Michael E. Porter of Harvard University. This framework was first published in Harvard Business Review in 1979.
Porter refers to these forces as the microenvironment, to contrast it with the more general term macroenvironment. They consist of those forces close to a company that affect its ability to serve its customers and make a profit. A change in any of the forces normally requires a business unit to re-assess the marketplace given the overall change in industry information. The overall industry attractiveness does not imply that every firm in the industry will return the same profitability. Firms are able to apply their core competencies, business model or network to achieve a profit above the industry average. A clear example of this is the airline industry. As an industry, profitability is low because the industry's underlying structure of high fixed costs and low variable costs afford enormous latitude in the price of airline travel. Airlines tend to compete on cost, and that drives down the profitability of individual carriers as well as the industry itself because it simplifies the decision by a customer to buy or not buy a ticket. A few carriers--Richard Branson's Virgin Atlantic is one--have tried, with limited success, to use sources of differentiation in order to increase profitability.
Porter's five forces include three forces from 'horizontal' competition--the threat of substitute products or services, the threat of established rivals, and the threat of new entrants--and two others from 'vertical' competition--the bargaining power of suppliers and the bargaining power of customers.
Porter developed his five forces framework in reaction to the then-popular SWOT analysis, which he found both lacking in rigor and ad hoc. Porter's five-forces framework is based on the structure–conduct–performance paradigm in industrial organizational economics. It has been applied to try to address a diverse range of problems, from helping businesses become more profitable to helping governments stabilize industries. Other Porter strategy tools include the value chain and generic competitive strategies.
Blue Ocean Strategy is a marketing theory from a book published in 2005 which was written by W. Chan Kim and Renée Mauborgne, professors at INSEAD and co-directors of the INSEAD Blue Ocean Strategy Institute. Based on a study of 150 strategic moves spanning more than a hundred years and thirty industries, Kim & Mauborgne argue that companies can succeed by creating "blue oceans" of uncontested market space, as opposed to "red oceans" where competitors fight for dominance, the analogy being that an ocean full of vicious competition turns red with blood.
They assert that these strategic moves create a leap in value for the company, its buyers, and its employees while unlocking new demand and making the competition irrelevant. The book presents analytical frameworks and tools to foster an organization's ability to systematically create and capture blue oceans.[1] The expanded edition of Blue Ocean Strategy was published in February, 2015.
The expanded edition updates all strategic moves in the book, bringing their stories up to the present, and adds new chapters on achieving strategic alignment and avoiding red ocean traps as well as expanding the discussion on sustainability and renewal.
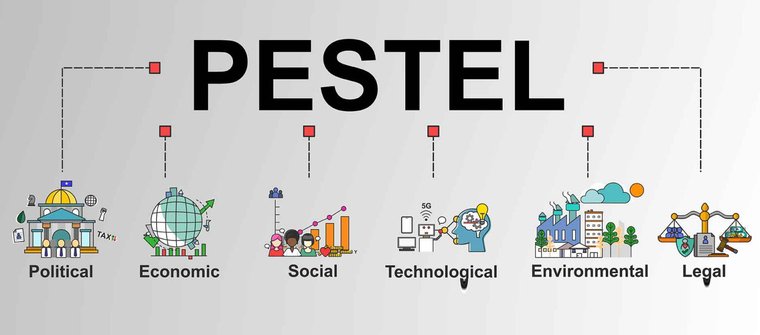
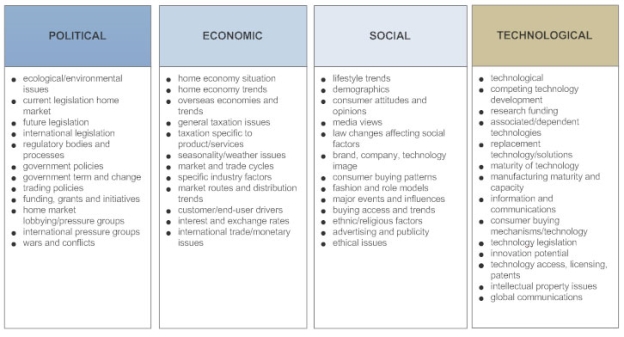
PEST analysis (political, economic, socio-cultural and technological) describes a framework of macro-environmental factors used in the environmental scanning component of strategic management. It is part of an external analysis when conducting a strategic analysis or doing market research, and gives an overview of the different macro-environmental factors to be taken into consideration. It is a strategic tool for understanding market growth or decline, business position, potential and direction for operations.
Variants that build on the PEST framework include:
PESTEL or PESTLE, which adds legal and environmental factors. Popular in the United Kingdom.
SLEPT, adding legal factors.
STEPE, adding ecological factors.
STEEPLE and STEEPLED, adding ethics and demographic factors.
DESTEP, adding demographic and ecological factors.
SPELIT, adding legal and intercultural factors. Popular in the United States since the mid-2000s.
STEP = PEST in more positive approach.
PESTEL = PEST + Environmental + Legal
PESTELI = PESTEL + Industry analysis
STEEP = PEST + Ethical
SLEPT = PEST + Legal
STEEPLE = PEST + Environmental + Legal + Ethical
STEEPLED = STEEPLE + Demographic
PESTLIED = PEST + Legal + International + Environmental + Demographic
LONGPEST = Local + National + Global factors + PEST
There is also STEER, which considers sociocultural, technological, economic, ecological, and regulatory factors, but does not specifically include political factors.[4]
The Macro Environment & Pest Analysis
"PESTLE анализ" - пошаговое руководство
PESTLE Analysis - Company, industry and country information - Subject guides at University of Sydney
Business plan template:
1. Introduction
2. Vision, Mission and Values
3. Internal and external environment (SWOT and PESTEL analysis)
4. Objectives
Objective 1: (For instance:) Reduce non-revenue water (description of the objective and the associated 2-3 Key Performance Indicators)
Objective 2: (For instance:) Optimise staff and organisational structure
Objective 3: (For instance:) Improve customer service and dialogue
Objective 4: (For instance:) Develop as a regional operator
Four objectives together providing for integrated results
5. Objective 1:
5.1 Best practice and current performance
(description of best practice and current performance for each of the 6-10 dimensions/activities associated with progress on that key objective)
5.2 Closing the gap
(definition of projected progress over forecast years)
5.3 Milestones: Annual defined level of achievement (a table showing a list of milestones for each of the dimensions for each forecast year)
6. Objective 2: etc.
7. Implementation
8. Financial viability (based on financial model – see Figure A B.1)
PEST Analysis is used to assess the market environment for a business.
There are variations of the model which identify other factors, although some researchers argue that those additional factors are just aspects of the main four. Variations include reorganization of the letters (ESTP, STEP) or the addition of Legal, Environmental, Ethical, Legislative, International, Industry, or Demography (PESTLE, STEEP, STEPE, STEEPLED, PESTELI).
Examples:
Suggested sources:
Political factors relate to government controls and influences over economy or industry. Government factors may be legislation or economic policies. The political environment can affect an industry through a range of factors, including:
· Trade tariffs
· Conflicts
· Taxation
· Fiscal policies
To find information on a city or country’s political environment, investigate the following sources.
Business Source Ultimate
Access Country Reports, the Political Risk Yearbook, and Marketline Country PESTLE reports. Business Source Ultimate aggregates a selection of business & economics journals, indexes and abstracts. Includes many full text scholarly journals. Provides company profiles for the world's 5,000 largest companies.
Factiva.com (mid-1980s - present)
Newspapers, company information, pictures and media transcripts from Australian and overseas media sources.For Australian news sources, the Fairfax publications archive includes The Sydney Morning Herald 1986+, Australian Financial Review 1987+, BRW 1989+, and the News Limited archive includes The Australian 1996+.
Australian Financial Review via Factiva has a 72-hour embargo on daily articles.
PAIS: Public Affairs Information Service
References to works in all subject areas which are relevant to contemporary social & political, economic & business issues, social sciences and public policy.
Parliament of Australia
Freely available Australian parliamentary documents including debates (Hansard), media releases, legislation, bills, second readings, explanatory memorandum, senate and house committee transcripts, background papers and research notes. The parliamentary website also includes links to Committee websites and Parliamentary papers index.
Parliament of New South Wales
Freely available New South Wales parliamentary documents including debates (Hansard), media releases, legislation, bills, second readings & explanatory memorandum, senate and house committee transcripts, background papers and research papers.
Looking for international political information? Try parliamentary websites.
Index of Economic Freedom: Promoting Economic Opportunity and Prosperity by Country
Transparency.org
American Economic Association
American Economic Association: JEL Codes
World Bank Document - wps21960RUSSIAN0govmatrs1r.pdf
Practical Business Python
Worldwide Governance Indicators (WGI) | Data Catalog
Business Source Ultimate | EBSCO
Recommended sources:
Examples:
Economic factors a have direct impact on a company’s long-term prospects in a market. The economic environment may affect how a company prices their products or influence the supply and demand model. Environmental factors can include:
· Inflation rate
· Disposable income
· Unemployment rate
· Interest rates
· Foreign exchange rates
· Economic growth patterns
To find information on a city of country’s economic environment, investigate the following sources.
Business Source Ultimate via Ebsco
Aggregation of business & economics journals, indexes and abstracts. Includes many full text scholarly journals. Provides company profiles for the world's 5,000 largest companies.
ABI/Inform Complete
International business/management database. Good for all topics including industry, economics, accounting & finance, marketing, human resources, organisational behaviour, and coaching psychology.
Passport & Passport
Passport provides market intelligence on industries, consumers and countries. The Economies tab at the top of the Passport homepage provides background information on each country e.g. ease of doing business, government stability etc.
ACCC
The Australian Competition and Consumer Commission, and contains information on fair trading, business rights and responsibilities and industry monitoring.
The Treasury
The Treasury is the Australian Government’s website on financial policy and includes economic and fiscal outlook documents, the budget and other information on Australia’s economy.
ASIC: Australian Securities and Investment Commission
The Australian Securities and Investment Commission is an independent government body that acts as a corporate regulator. It provides information about companies and organisations and finance news.
Productivity Commission
The Productivity Commission is the Australian Government’s principal review and advisory body on microeconomic policy and regulation. It provides information on current ongoing enquiries, economic news and regulatory reviews.
OECD iLibrary
The Organisation for Economic Co-operation and Development is an intergovernmental economic organisation with 36 member countries, founded in 1961 to stimulate economic progress and world trade. The OECD iLibrary provides economic information for all member countries, as well as reports, documents and statistical data.
Recommended Resources:
Recommended Sources:
Examples:
Occupation | Religion of Jehovah's Witnesses | CRC NSW
Social factors, such as demographics and culture can impact the industry environment by influencing peak buying periods, purchasing habits, and lifestyle choices. Society is important as people’s culture and lifestyle can influence when, where and how they are likely to engage with products and services. Social factors can include:
· Religion and ethics
· Consumer buying patterns
· Demographics
· Health
· Opinions and attitudes
· Media
· Brand preferences
· Education
To find information on the social and cultural factors in a city of country, investigate the following resources.
Factiva
Factiva provides access to an extensive archive of news articles, broadcasts, industry publications and news sites. Check Factiva for news and publications relating to your industry.
Statista
Access statistics and reports on consumer markets, countries, industries, companies, brands, and trends worldwide
Productivity Comission
The Productivity Commission is the Australian Government’s principal review and advisory body on microeconomic policy and regulation. It provides information on current ongoing enquiries, economic news and regulatory reviews.
Consumer Information Guide
The Library's Consumer Information Subject Guide carries a huge variety of sources to help identify consumers, consumer preferences, and research into particular demographics.
APA-FT: Australian Public Affairs Full Text via Informit Online (1978 - present)
The place to start for coverage of Australia's political, economic, social and cultural affairs. Broad-ranging coverage also includes Australian humanities and social sciences, current affairs, and law.
ABS – Australian Bureau of Statistics
The Australian Bureau of Statistics website gives access to all of Australia’s census and demographic data, as well as related news releases.
Examples:
Technological factors may have a direct or an indirect influence on an industry. While some industries will be more affected by technology than others, innovations in technology may affect the market and consumer choices and buying power. Technological factors can include:
· Automation
· Technological development
· Patents
· Licensing
· Communication
· Information technology
· Research and Development
· Technological awareness
To find information on the technological factors in a city of country, investigate the following resources.
Statista
Access statistics and reports on consumer markets, countries, industries, companies, brands, and trends worldwide
Business Source Ultimate
Aggregation of business & economics journals, indexes and abstracts. Includes many full text scholarly journals. Carries industry reports and academic research in technology-related fields such as ICT and communications.
Scopus
Scopus is a large multidisciplinary database covering published material in the humanities and sciences. Use keyword searches for academic research looking at specific technologies, or particular industries.
Factiva.com (mid-1980s - present)
Newspapers, company information, pictures and media transcripts from Australian and overseas media sources.For Australian news sources, the Fairfax publications archive includes The Sydney Morning Herald 1986+, Australian Financial Review 1987+, BRW 1989+, and the News Limited archive includes The Australian 1996+.
Recommended Sources:
Examples:
Legal factors may affect both the internal and external environment of a company. The legal and regulatory environment can affect the policies and procedures of an industry, and can control employment, safety and regulations. Legal factors can include:
· Employment laws
· Consumer protection
· Industry specific regulations
· Regulatory bodies
· Environmental regulations
To find information on the legal factors in a city of country, investigate the following resources.
AustLII: Free access to Australasian legal materials, including legislation, decisions of courts and tribunals, and treaties. Articles from law journals and law reform commission reports are among its secondary materials.
WorldLII: Provides free access to primary and some secondary legal materials from overseas jurisdictions. Includes International law databases.
AGIS Plus Text: Attorney General's Information Service via Informit Online (1975 - present)
Covering all aspects of Australian law, and an authoritative collection for primary legal research in comparative and Commonwealth law. Includes articles, reports, and books from Australia, New Zealand and the Asia Pacific region, plus selected material from the United Kingdom, U.S. and Canada starting from 1999.
http://library.deakin.edu.au/record=b2975048
ACCC: The Australian Competition and Consumer Commission, and contains information on fair trading, business rights and responsibilities and industry monitoring.
Recommended Sources:
Examples:
Environmental factors include all those relating to the physical environment and to general environmental protection requirements. While the environment is more important to some industries, such as tourism, agriculture or food production, these factors may influence a range of different industries and are worth being aware of. Environmental factors include:
· Climate
· Geographical location
· Stakeholder and consumer values
· Environmental offsets
· Weather
· Global climate change
To find information on the environmental factors in a city of country, investigate the following resources.
Environment Complete via Ebsco: Covers all areas of environmental research and technology, environmental law, public policy, social impacts, urban planning, and more. Coverage starts in the 1940s.
Web of Science Core Collections: This portal hosts Web of Science, Current Contents Connect, BIOSIS Previews, CAB Abstracts, MEDLINE, and via the Additional Resources tab, Journal Citation Reports. Its CrossSearch feature enables a "quick overview" search of these databases and also searches Agricola and Pubmed.
MEDGE: Management and Environment Information via Informit Online (1985 - 2006)
Indexed articles on management issues for business and government.
P.E.S.T.E.L. or P.E.S.T.L.E. -is a method by which to analyze a company, industry or product. The acronym stands for:
It is more in-depth than a S.W.O.T. analysis which looks at Strengths, Weaknesses, Opportunities, Threats.
Starting Points-in order to analyze the company, industry or product, you will probably want to start by looking at the following resources:
Company and Government Websites:
Databases:
Print Resources:
Associations -look for industry associations or organizations. These often lobby for members, disseminate statistics and news about the industry including legal, technology and new product information. Try the following:
Industry Publications -determine key industry publications and which databases they may be in. Not every publication is available in electronic databases. You may have to get articles via Interlibrary Loan.
In his 1967 book, Scanning the Business Environment, Francis Joseph Aguilar identified four aspects of the external environment in which an industry operates: Economic, Technological, Political, Social (ETPS).
Other authors have reorganized the letters and added new categories over the years. The following articles include some of the variants.
PESTLE Analysis - Company, industry and country information - Subject guides at University of Sydney
PESTEL Analysis (PEST Analysis) EXPLAINED with EXAMPLES | B2U
An Example of Using PESTEL Template for Strategic Planning
پادکست آیا تحلیل پست برای همه کسب و کارها لازم است؟
COVID-19: Business Continuity Strategy Template + 6 Best Practices
از چه ابزاری برای تحلیل محیطی استفاده کنیم؟ تحلیل PESTEL - گروه پژوهشی آریانا
Factors and frameworks for analysis of the general external environment | Course Hero
estemple analysis example – Google Поиск
از چه ابزاری برای تحلیل محیطی استفاده کنیم؟ تحلیل PESTEL - گروه پژوهشی آریانا
پادکست آیا تحلیل پست برای همه کسب و کارها لازم است؟
تحلیل پست (PEST) - ایران استراتژیست
What is Pest Analysis? Definition of Pest Analysis, Pest Analysis Meaning - The Economic Times
An Example of Using PESTEL Template for Strategic Planning
Useful management tools PESTLE analysis
COVID-19 Impact Analysis Summary | BMS
Scenario planning, also called scenario thinking or scenario analysis, is a strategic planning method that some organizations use to make flexible long-term plans. It is in large part an adaptation and generalization of classic methods used by military intelligence[1].
The original method was that a group of analysts would generate simulation games for policy makers. The games combine known facts about the future, such as demographics, geography, military, political, industrial information, and mineral reserves, with key driving forces identified by considering social, technical, economic, environmental, and political (STEEP) trends.
In business applications, the emphasis on gaming the behavior of opponents was reduced (shifting more toward a game against nature). At Royal Dutch/Shell for example, scenario planning was viewed as changing mindsets about the exogenous part of the world, prior to formulating specific strategies[2][3].
Scenario planning may involve aspects of systems thinking, specifically the recognition that many factors may combine in complex ways to create sometime surprising futures (due to non-linear feedback loops). The method also allows the inclusion of factors that are difficult to formalize, such as novel insights about the future, deep shifts in values, unprecedented regulations or inventions[4]. Systems thinking used in conjunction with scenario planning leads to plausible scenario storylines because the causal relationship between factors can be demonstrated [5]. In these cases when scenario planning is integrated with a systems thinking approach to scenario development, it is sometimes referred to as dynamic scenarios.
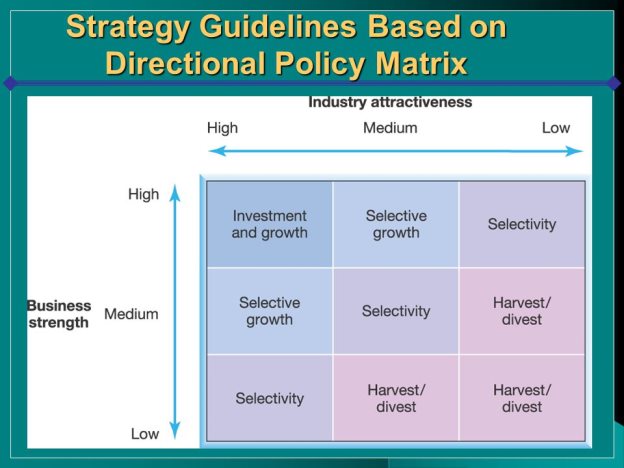
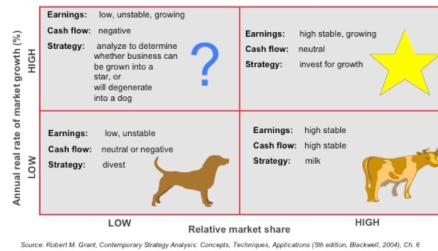
The growth–share matrix (aka the product portfolio matrix, Boston Box, BCG-matrix, Boston matrix, Boston Consulting Group analysis, portfolio diagram) is a chart that was created by Bruce D. Henderson for the Boston Consulting Group in 1970 to help corporations to analyze their business units, that is, their product lines. This helps the company allocate resources and is used as an analytical tool in brand marketing, product management, strategic management, and portfolio analysis. Some analysis of market performance by firms using its principles has called its usefulness into question.
این ماتریس با در نظر گرفتن دو فاکتور رشد جذابیت صنعت و سهم نسبی در صنعت وضعیت هر شرکت را در صنعت مربوط به خود مشخص کرده و پیش بینی چگونگی تخصیص منایع مالی و گردش نقدی را برای سودآوری بیشتر و بقاء در آن کسب و کار مشخص میکند.
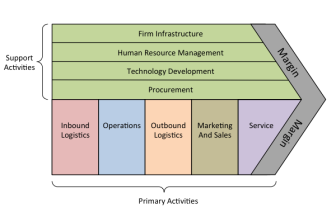
A value chain is a set of activities that a firm operating in a specific industry performs in order to deliver a valuable product or service for the market. The concept comes through business management and was first described by Michael Porter in his 1985 best-seller, Competitive Advantage: Creating and Sustaining Superior Performance.
The idea of the value chain is based on the process view of organizations, the idea of seeing a manufacturing (or service) organization as a system, made up of subsystems each with inputs, transformation processes and outputs. Inputs, transformation processes, and outputs involve the acquisition and consumption of resources – money, labour, materials, equipment, buildings, land, administration and management. How value chain activities are carried out determines costs and affects profits.
— IfM, Cambridge
The concept of value chains as decision support tools, was added onto the competitive strategies paradigm developed by Porter as early as 1979.[dubious – discuss] In Porter's value chains, Inbound Logistics, Operations, Outbound Logistics, Marketing and Sales, and Service are categorized as primary activities. Secondary activities include Procurement, Human Resource management, Technological Development and Infrastructure (Porter 1985, pp. 11–15).
According to the OECD Secretary-General (Gurría 2012) the emergence of global value chains (GVCs) in the late 1990s provided a catalyst for accelerated change in the landscape of international investment and trade, with major, far-reaching consequences on governments as well as enterprises (Gurría 2012).
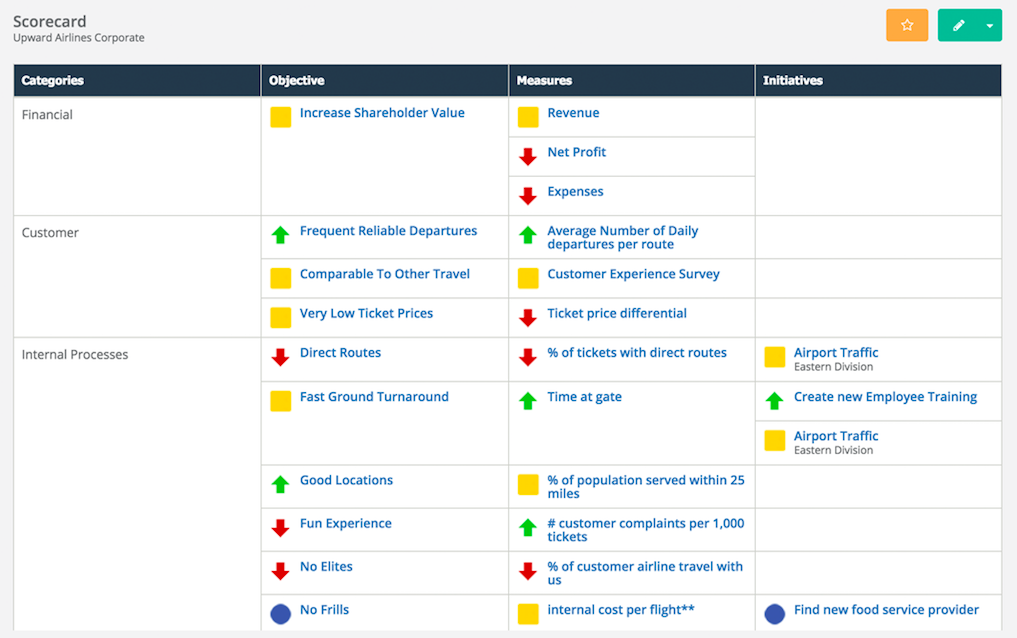
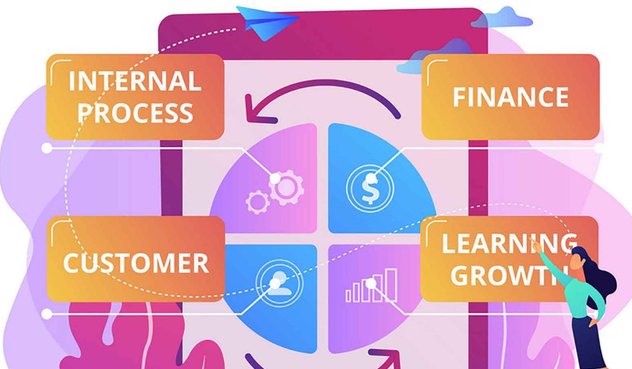
The balanced scorecard is a strategy performance management tool – a semi-standard structured report, supported by design methods and automation tools, that can be used by managers to keep track of the execution of activities by the staff within their control and to monitor the consequences arising from these actions.
The phrase 'balanced scorecard' primarily refers to a performance management report used by a management team, and typically this team is focused on managing the implementation of a strategy or operational activities - in a recent survey 62% of respondents reported using Balanced Scorecard for strategy implementation management, 48% for operational management. Balanced Scorecard is also used by individuals to track personal performance, but this is less common - only 17% of respondents in the survey using Balanced Scorecard in this way, however it is clear from the same survey that a larger proportion (about 30%) use corporate Balanced Scorecard elements to inform personal goal setting and incentive calculations.
The critical characteristics that define a balanced scorecard are:
- its focus on the strategic agenda of the organization concerned
- the selection of a small number of data items to monitor
- a mix of financial and non-financial data items.
Business Source Premier -- scroll down to Business Source Premier and select "Enhanced Business Searching Interface" and then Browse: Country Reports
Business Monitor International
CountryWatch Incorporated
TRADING ECONOMICS tradingeconomics.com
Global economy, world economy theglobaleconomy.com
Organisation for Economic Co-operation and Development data.oecd.org
https://pmpiran.com/pestel-analysis/
https://www.sciencedirect.com/science/article/abs/pii/S0360544296001636
https://libguides.library.usyd.edu.au/market_intelligence/PESTLE
https://guides.ucf.edu/man4720/pestle-analysis
https://library.uhv.edu/company-industry/pestel
https://libguides.libraries.wsu.edu/c.php?g=294263&p=4358409
https://www.marketwatch.com/press-release/global-decision-support-system-dss-market-2021-growth-trend-analysis-future-opportunities-and-industry-forecast-to-2027-2021-08-10
تحلیل PESTEL چیست | ابزاری برای تحلیل محیط کسب و کار | نوین
تجزیه و تحلیل بر اساس مدل PESTLE چیست و چه کاربردی دارد؟ | کار و کسب
A Strategic Organisational Perspective of Industry 4.0: A Conceptual Model | SpringerLink
Fourth Industrial Revolution: Opportunities, Challenges, and Proposed Policies | IntechOpen
Report Directory of industry
Database & Directory Publishing in the World- Industry Data
Business Directory
Industry Directories
Reports - Directories | Official Texas Economic DevelopmentvGlobal Hunger Index - Official Website of the Peer-Reviewed Publication
Human Development Index (HDI) | Human Development Reports
Human Development Reports
Gini index or Gini coefficient (World Bank estimate) | Data
Institute for Health Metrics and Evaluation
Data at WHO
Worldometer - real time world statistics
Coronavirus
Коронавирус. Онлайн карта распространения коронавируса. Коронавирус в России и мире.
Информация о новой коронавирусной инфекции
Карта распространения коронавируса в России и мире
Stockholm International Peace Research Institute | SIPRI
Institute for the Study of War
The United Nations Statistics Data
Global Passport Power Rank | Passport Index 2020
Henley Passport Index 2006 to 2020
List of languages by total number of speakers
List of countries by proven oil reserves
List of countries by oil production
Pew Research Center | Pew Research Center
List of Wikipedias
The Royal Islamic Strategic Studies Centre | RISSC
فهرست جمعیتهای دینی
گروههای دینی اصلی
U.S. Bureau of Labor Statistics
Global Terrorism Index 2018 | Measuring the impact of global terrorism
Satellites by Country or Organization
Real time satellite tracking and predictions | uphere.space
Alexa - Top Sites by Category: Top/Society/Religion_and_Spirituality
moreover api - Поиск в Google
Moreover API (Overview, Documentation & Alternatives) | RapidAPI
About Corporate Register - FAQs
Digitallibraryplus
Daneshyar.net
UMI
Sciencedirect
Sagepub
Springerlink
Scopus
ISI Knowledge
سازمان ملل متحد (UN)
در بانک توسعه آفریقا (ADB)
کمیسیون اقتصادی آفریقا (ECA)
سازمان خواربار و کشاورزی ملل متحد (FAO)
گروه ۷۷ (G-۷۷)
بانک بینالمللی ترمیم و توسعه (IBRD)
سازمان وحدت آفریقا (OAU)
جنبش غیرمتعهد (NAM)
سازمان کنفرانس اسلامی (OIC)
سازمان تجارت جهانی (WTO)
صندوق بینالمللی پول (IMF)
سازمان بینالمللی هواپیمایی کشوری (ICAO)
اتاق بازرگانی اسلامی (ICC)
جامعه بینالمللی توسعه (IDA)
صندوق بینالمللی توسعه کشاورزی (IFAD)
سازمان بینالمللی کار (ILO)
سازمان بینالمللی ارتباطات دور ماهوارهای (INTELSAT)
کمیسیون سازمان ملل متحد برای تجارت و توسعه (UNCTAD)
سازمان جهانی مالکیت معنوی (WIPO)
سازمان هواشناسی جهانی (WMO)
سازمان جهانی بهداشت (WHO)
مرکز آمار و اطلاعات راهبردی
مرکزملی آمار
پژوهشکده آمار
انجمن آمار موسسه آموزش عالی جهاد دانشگاهی
بانک مرکزی ایران
دفتر توسعه و هماهنگی نظام آماری وزارت بهداشت ُدرمان و آموزش
مرکز آمار واطلاعات زنان ایران
مرکز آمار و اطلاعات راهبردی
خانه آمار استان اصفهان
دفتر آمار و فناوری اطلاعات وزارت بهداشت
انجمن آمار ایران
درگاه ملی ایران(مرکز آمار ایران)
انجمن آمار موسسه آموزش عالی جهاد دانشگاهی
پژوهشکده آمار
خانه ریاضیات استان اصفهان
سایت تخصصی آمار (برترین سایت آموزش آماری )
American Statistical Association (ASA)
The United Nations Statistics Division(UNSD)
UNFPA - United Nations Population Fund
SIAP - Statistical Institute for Asia and the Pacific
ISI - International Statistical Institute
انجمن آمار امریکا
بخش آمار سازمان ملل متحد
انجمن بین المللی آمارهای رسم
مرکز مطالعات آماری،اقتصادیواجتماعی کشورهای اسلامی
صندوق جمعیت ملل متحد
شرکتspss
محاسبات آماری به صورتonline
آمارهای جهانی
موسسه آمار سازمان ملل متحد برای آسیا و اقیانوسیه
انجمن آمار کانادا
انجمن آمار انگلیس
انجمن آمار واشنگتن
انجمن برنولی
انجمن آمار فنلاند
انجمن بین المللی تحلیل بیزی
مجموعه ژورنالهای تخصصی آماری
سایت آمار در پژوهش
آموزش آمار به زبان ساده
انجمن آمار سلطنتی
انجمن بین المللی محاسبات آماری (IASC)
انجمن بین المللی بیومتریک (IBS)
انجمن بین المللی تحلیلهای بیزی (ISBA)
موسسه بین المللی آمار (ISI)
موسسه ملی آمار (INS/INS)
Statistical Education Sites
تاریخ احتمالات(فارسی)
تاریخچه آمار(انگلیسی)
زندگی نامه دانشمندان آماری(انگلیسی)
جداول آماری(انگلیسی)
Statistical software
Bayesian Data Mining - Bayesia
Computer Programs For Epidemiologic Analysis - PEPI
Datadesk
Ecological Inference - EI
Epi Info
Gauss
Genstat
Glim
GPOWER Software site
JAVA statistical applets page
Lisrel
MedCalc
Minitab
MX
NCSS Statistical Software
Prophet Software
SAS for Macintosh Resource Page
SAS Institute
Simstat
Stata
StatSoft, Inc.
Structural Equation Modeling Made Simple - STREAMS
S-Plus
SPSS, Inc.
Visual Statistics System - ViSta
Unistat Statistical Package
معرفی سایتهای مفید آماری
گنجینه آماری - معتبرترین سایتهای آماری ایرانی و خارجی
سایتهای معتبر آماری | اداره آمار و اطلاع رسانی
Home - Transparency.org corruption index
Agriculture & Rural Development
Aid Effectiveness
Climate Change
Economic Policy & External Debt
Education
Energy & Mining
Environment
Financial Sector
Gender
Health
Infrastructure
Labor & Social Protection
Poverty
Private Sector
Public Sector
Science & Technology
Social Development
Urban Development
World Development Indicators (WDI) is the primary World Bank collection of development indicators, compiled from officially recognized international sources. It presents the most current and accurate global development data available, and includes national, regional and global estimates. [Note: Even though Global Development Finance (GDF) is no longer listed in the WDI database name, all external debt and financial flows data continue to be included in WDI. The GDF publication has been renamed International Debt Statistics (IDS), and has its own separate database, as well.
Statistical Capacity Indicators
Statistical Capacity Indicators provides information on various aspects of national statistical systems of developing countries, including an overall country-level statistical capacity indicator.
Education Statistics - All Indicators
The World Bank EdStats Query holds around 2,500 internationally comparable education indicators for access, progression, completion, literacy, teachers, population, and expenditures. The indicators cover the education cycle from pre-primary to tertiary education. The query also holds learning outcome data from international learning assessments (PISA, TIMSS, etc.), equity data from household surveys, and projection data to 2050.
Data on key gender topics. Themes included are demographics, education, health, labor force, and political participation.
Health Nutrition and Population Statistics
Key health, nutrition and population statistics gathered from a variety of international sources.
Poverty and Equity Database.
Objective measures of business regulations and their enforcement across economies and selected cities at the subnational and regional level.
IDA Results Measurement System, Tier I Database – WDI
Measures progress on aggregate outcomes for IDA countries for selected indicators.
Database of official indicators for monitoring progress toward Millennium Development Goals.
Jointly developed by the World Bank and the International Monetary Fund, the database brings together detailed public sector debt data of selected developing /emerging market countries .
Brings together external debt data and selected foreign assets from international creditor/market sources - jointly developed by the Bank for International Settlements (BIS), the International Monetary Fund (IMF), the Organization for Economic Cooperation and Development (OECD) and the World Bank (WB).
Global data on individuals, firms, and the business environments.
Examines growth trends for the global economy and how they affect developing countries. The reports include three-year forecasts for the global economy and long-term global scenarios which look ten years into the future.
Africa Development Indicators 2012/13 provides the most detailed collection of data on Africa available in one volume. It contains macroeconomic, sectoral, and social indicators, covering 53 African countries. Additional data may be found on the companion time series database, covering over 1,700 indicators from 1960 to 2011. Designed to provide all those interested in Africa with quick reference and a reliable set of data to monitor development programs and aid flows in the region, Africa Development Indicators is an invaluable reference tool for analysts and policy makers who want a better understanding of the economic and social developments occurring in Africa. The new Africa DataFinder app is now available on both iTunes and Google Play
Worldwide Governance Indicators
Aggregate and individual governance indicators for six dimensions of governance: Voice and Accountability; Political Stability and Absence of Violence/Terrorism; Government Effectiveness; Regulatory Quality; Rule of Law; Control of Corruption.
Population estimates and projections
Health Nutrition and Population Statistics: Population estimates and projections
Health Nutrition and Population Statistics by Wealth Quintile
Landmine Contamination Casualties and Clearance (LC3D): Country level data on a broad range of issues related to landmines and cluster munitions, including contamination, casualties and clearance, and their associated cost.
Enterprise Surveys: The world's most comprehensive company-level data in emerging markets and developing economies.
Global Economic Monitor (GEM): Daily updates of global economic developments for high income and developing countries - covers exchange rates, equity markets, interest rates, stripped bond spreads, and emerging market bond indices. Monthly data coverage (updated daily and populated upon availability) is provided for consumer prices, high-tech market indicators, industrial production and merchandise trade.
Exporter Dynamics Database – Indicators at Country-Year Level: The Exporter Dynamics Database is the first database providing indicators for close to 70 countries over the period 1997-2014 on the basic characteristics of their exporting firms, their concentration and diversification, their dynamics in terms of entry, exit and survival, and the unit prices of the goods they trade. This particular sub-database provides indicators at the country-year level, all are calculated based on exporter-level customs data for each country.
Exporter Dynamics Database – Indicators at Country-Destination-Year Level: The Exporter Dynamics Database is the first database providing indicators for close to 70 countries over the period 1997-2014 on the basic characteristics of their exporting firms, their concentration and diversification, their dynamics in terms of entry, exit and survival, and the unit prices of the goods they trade. This particular sub-database provides indicators at the country-destination-year level, all are calculated based on exporter-level customs data for each country.
Exporter Dynamics Database – Indicators at Country-Product HS2-Destination-Year Level: The Exporter Dynamics Database is the first database providing indicators for close to 70 countries over the period 1997-2014 on the basic characteristics of their exporting firms, their concentration and diversification, their dynamics in terms of entry, exit and survival, and the unit prices of the goods they trade. This particular sub-database provides indicators at the country-HS 2-digit product-destination-year level, all are calculated based on exporter-level customs data for each country.
Exporter Dynamics Database – Indicators at Country-Product HS2-Year Level: The Exporter Dynamics Database is the first database providing indicators for close to 70 countries over the period 1997-2014 on the basic characteristics of their exporting firms, their concentration and diversification, their dynamics in terms of entry, exit and survival, and the unit prices of the goods they trade. This particular sub-database provides indicators at the country-HS 2-digit product-year level, all are calculated based on exporter-level customs data for each country.
Exporter Dynamics Database – Indicators at Country-Product HS4-Year Level: The Exporter Dynamics Database is the first database providing indicators for close to 70 countries over the period 1997-2014 on the basic characteristics of their exporting firms, their concentration and diversification, their dynamics in terms of entry, exit and survival, and the unit prices of the goods they trade. This particular sub-database provides indicators at the country-HS 4-digit product-year level, all are calculated based on exporter-level customs data for each country.
Exporter Dynamics Database – Indicators at Country-Product HS6-Year Level: The Exporter Dynamics Database is the first database providing indicators for close to 70 countries over the period 1997-2014 on the basic characteristics of their exporting firms, their concentration and diversification, their dynamics in terms of entry, exit and survival, and the unit prices of the goods they trade. This particular sub-database provides indicators at the country-HS 6-digit product-year level, all are calculated based on exporter-level customs data for each country.
Exporter Dynamics Database – Indicators at Country-Industry ISIC-Year Level: The Exporter Dynamics Database is the first database providing indicators for close to 70 countries over the period 1997-2014 on the basic characteristics of their exporting firms, their concentration and diversification, their dynamics in terms of entry, exit and survival, and the unit prices of the goods they trade. This particular sub-database provides indicators at the country-3-digit ISIC industry-year level, all are calculated based on exporter-level customs data for each country.
International Debt Statistics: International Debt Statistics (IDS)—formerly known as Global Development Finance (GDF)—provides external debt and financial flows statistics for countries that report public and publicly-guaranteed debt under the World Bank's Debtor Reporting System (DRS).
International Comparison Program (ICP) 2005: A collection of comparative price data and detailed expenditure values of countries’ gross domestic products (GDP), and purchasing power parities (PPPs) estimates of the world’s economies.
Global Bilateral Migration: Global matrices of bilateral migrant stocks spanning the period 1960-2000, disaggregated by gender and based primarily on the foreign-born concept.
UNCTAD - Trade Analysis Information System (TRAINS): The United Nations Conference on Trade and Development (UNCTAD) Trade Analysis Information System (TRAINS) contains information on Imports, Tariffs and Non-Tariff Measures over 150 countries. For more detailed analysis of Tariff data you can also access it through the World Integrated Trade Solution (WITS).
Global Financial Inclusion: The Global Financial Inclusion Database provides over 800 country-level indicators of financial inclusion summarized for all adults and disaggregated by key demographic characteristics?gender, age, education, income, and rural residence. Covering more than 150 economies, the indicators of financial inclusion measure how people save, borrow, make payments and manage risk.
The Atlas of Social Protection: Indicators of Resilience and Equity: The World Bank's ASPIRE online tool is the most up-to-date compilation of global social protection and labor (SPL) indicators, based on household survey and administrative data from over 150 countries—mostly in the developing world. ASPIRE provides harmonized indicators on populations' socio-economic status, social expenditure and SPL programs performance, such as coverage, targeting accuracy, adequacy of benefits and simulated SPL program impact on poverty and inequality. The portal also provides full documentation of the methodology and harmonization of SPL programs.
Country Policy and Institutional Assessment: The World Bank's Country Policy and Institutional Assessment is done annually for all its borrowing countries. It has evolved into a set of criteria, which are grouped in four clusters: (a) economic management; (b) structural policies; (c) policies for social inclusion and equity; and (d) public sector management and institutions. The number of criteria, currently sixteen, reflect a balance between ensuring that all key factors that foster pro-poor growth and poverty alleviation are captured, without overly burdening the evaluation process. Ratings for each of the criteria reflect a variety of indicators, observations, and judgments. They focus on the quality of each country's current policies and institutions - which are the main determinant of present aid effectiveness prospects. To fully underscore the importance of the CPIA in the IDA Performance Based Allocations, the overall country score is referred to as the IDA Resource Allocation Index (IRAI).
Global Partnership for Education
Global Financial Development: The Global Financial Development Database is an extensive dataset of financial system characteristics for 203 economies. The database includes measures of (1) size of financial institutions and markets (financial depth), (2) degree to which individuals can and do use financial services (access), (3) efficiency of financial intermediaries and markets in intermediating resources and facilitating financial transactions (efficiency), and (4) stability of financial institutions and markets (stability). For a complete description of the dataset and a discussion of the underlying literature, see: Martin Cihák, Asli Demirgüç-Kunt, Erik Feyen, and Ross Levine, 2012. Benchmarking Financial Systems Around the World.World Bank Policy Research Working Paper 6175, World Bank, Washington, D.C.
G20 Financial Inclusion Indicators: The G20 Basic Set of Financial Inclusion data repository includes detailed data from users and providers of financial services. The Basic Set measures both access to financial services (“supply-side” data) and usage of services (“demand-side” data). The Basic Set covers both individuals and small and medium sized enterprises (SME’s) and includes data from three sources and 192 countries. The five basic set indicators are as follows: 1.The percentage of adults with a formal account; 2. The percentage of adults that use formal credit; 3. The percentage of SME’s with a formal account; 4. The percentage of SME’s that use formal credit; and 5. Bank branch penetration
ESCAP World Bank: International Trade Costs: The Trade Costs Dataset provides estimates of bilateral trade costs in agriculture and manufactured goods. It is built on trade and production data collected in over 200 countries. Symmetric bilateral trade costs are computed using the Inverse Gravity Framework (Novy 2009), which estimates trade costs for each country pair using bilateral trade and gross national output.
Sustainable Energy for All: The “Sustainable Energy for all (SE4ALL)” initiative, launched in 2010 by the UN Secretary General, established three global objectives to be accomplished by 2030: to ensure universal access to modern energy services, to double the global rate of improvement in global energy efficiency, and to double the share of renewable energy in the global energy mix. SE4ALL database supports this initiative and provides country level historical data for access to electricity and non-solid fuel; share of renewable energy in total final energy consumption by technology; and energy intensity rate of improvement.
Service Delivery Indicators: The Service Delivery Indicators program is an application of the principles of the 2004 World Development Report Making Services Work for Poor People. The Service Delivery Indicators project is a new Africa-wide initiative that tracks service delivery in education and health across countries and over time. The project collects nationally representative data that focus mainly on performance and quality of service delivery in primary schools and at frontline health facilities. This partnership between the World Bank, the African Development Bank and the African Economic Research Consortium brings together development economists and sector specialists. The objective is to reposition the dialogue on human development in Africa within the context of effectiveness of public spending and accountability for service delivery.
Adjusted Net Savings: Adjusted Net Savings (ANS) is measured as gross national saving minus the depreciation of produced capital, depletion of subsoil assets and timber resources, the cost of pollution damages, plus a credit for education expenditures. This dataset includes ANS and its underlying components (including natural resource rents), as well as adjusted Net National Income (aNNI).
Indonesia Database for Policy and Economic Research: The Indonesia Database for Policy and Economic Research (INDO-DAPOER) contains over 200 province- and district-level indicators which span across four main categories: fiscal, economic, social and demographic, as well as infrastructure.
Subnational Malnutrition: Subnational estimates of child malnutrition (prevalence for stunting, underweight, overweight, wasting and severe wasting indicators).
LAC EQUITY LAB : Poverty, shared prosperity, and equity indicators for LAC
India Power Sector Review Database: This database underpins the analysis in the report “More Power to India: The Challenge of Electricity Distribution”. The database is a collection of primary and secondary data on the Indian power sector, collected at the utility and state levels. It covers 87 power utilities and 29 states and spreads over the years 2003 to 2011 across dimensions such as operational and financial performance, market structure, implementation of reforms and corporate and regulatory governance.
Country Partnership Strategy for India (FY2013-17): A selection of Indian sub-national (state) indicators on economic and social sectors relevant to the World Bank Group Country Partnership Strategy for India for the period 2013-2017. It is a compilation of data from official national sources that highlight the development challenges the World Bank Group in partnership with the Government of India, aims to address through its financing and knowledge program. See also http://openindia.worldbankgroup.org
Agriculture in Africa – Telling Facts from Myths: Indicators derived on the "Agriculture in Africa – Telling Facts from Myths" project
National Poverty Line - Subnational Poverty: Poverty data at the administrative unit level 1, based on national poverty line(s). Administrative unit level 1 refers to the highest subnational unit level (examples include ‘state’, ‘governorate’, ‘province’)
Quarterly External Debt Statistics GDDS: In October 2014, the World Bank launched the new Quarterly External Debt Statistics (QEDS) GDDS database consistent with the classifications and definitions of the 2013 External Debt Statistics: Guide for Compilers and Users (2013 EDS Guide) and Sixth Edition of Balance of Payments and International Investment Position Manual (BPM6). The QEDS GDDS database provides external debt data, starting from 2002Q4, for an extension of countries that participate in the IMF's General Data Dissemination System (GDDS).
Quarterly External Debt Statistics SDDS: In October 2014, the World Bank launched the new Quarterly External Debt Statistics (QEDS) SDDS database consistent with the classifications and definitions of the 2013 External Debt Statistics: Guide for Compilers and Users (2013 EDS Guide) and Sixth Edition of Balance of Payments and International Investment Position Manual (BPM6). The QEDS SDDS database provides detailed external debt data starting from 1998Q1. Data are published individually by countries that subscribe to the IMF’s Special Data Dissemination Standard (SDDS), as well as, GDDS participating countries that are in a position to produce the external debt data prescribed by the SDDS.
WDI Database Archives (beta): The WDI Database Archives (WDI-DA) contains previous versions of the World Development Indicators database. Data are drawn from all available electronic releases going back to 1989. Metadata for this initial beta release, however, are only available from the latest WDI database. Users should exercise caution when comparing data from different versions, as the same codes have been used to reference series from different base years or different valuations of a country’s local currency. For example, the series code for constant US dollar GDP (NY.GDP.MKTP.KD), which is currently based in 2010, has been used in previous editions when the base year was 1987, 1995, 2000, and 2005. We will be working to improve the usability of the archives by harmonizing codes and names to the extent possible and adding additional metadata.
Subnational Population: Subnational Population Database presents estimated population at the first administrative level below the national level. Many of the data come from the country’s national statistical offices. Other data come from the NASA Socioeconomic Data and Applications Center (SEDAC) managed by the Center for International Earth Science Information Network (CIESIN) , Earth Institute, Columbia University. It is the World Bank Group’s first subnational population database at a global level and there are data limitations. Series metadata includes methodology and the assumptions made.
Sustainable Development Goals (SDGs): Relevant indicators drawn from the World Development Indicators, reorganized according to the goals and targets of the Sustainable Development Goals (SDGs). These indicators may help to monitor SDGs, but they are not always the official indicators for SDG monitoring.
International Comparison Program (ICP) 2011: A set of comparable international price and volume measures of gross domestic products (GDP) and expenditure aggregates for 199 countries that participated in the 2011 round of International Comparison Program (ICP) and estimates for 15 non-participating countries. The data covers 26 expenditures categories for goods and services, and several indicators including purchasing power parities (PPPs), expenditure shares of GDP, total and per capita expenditures in US dollar both in exchange rate terms and PPP terms, and price level Indices. For further information see http://www.worldbank.org/en/programs/icp
Total wealth is calculated by summing up estimates of each component of wealth: produced capital, natural capital, human capital, and net foreign assets. The construction of the wealth accounts is guided by the concepts and methods of the System of National Accounts (SNA), the handbook developed by the UN Statistical Commission used by virtually all countries to compile their national economic accounts. While values for produced capital and net foreign assets are generally derived from widely used methods based on observed transactions for these assets, the value of natural capital and human capital must be estimated. The approach to asset valuation is based on the concept that the value of an asset should equal the discounted stream of expected net earnings (resource rents or wages) that it earns over its lifetime.
Economic Fitness: Economic Fitness (EF) is both a measure of a country’s diversification and ability to produce complex goods on a globally competitive basis. Countries with the highest levels of EF have capabilities to produce a diverse portfolio of products, ability to upgrade into ever-increasing complex goods, tend to have more predictable long-term growth, and to attain good competitive position relative to other countries. Countries with low EF levels tend to suffer from poverty, low capabilities, less predictable growth, low value-addition, and trouble upgrading and diversifying faster than other countries. The comparison of the Fitness to the GDP reveals hidden information for the development and the growth of the countries.
Africa Infrastructure: Airport
Africa Infrastructure: WSS Utility
Africa Infrastructure: Electricity
Africa Infrastructure: National Data
Africa Infrastructure: Railways
Africa Development Entrepreneurship
Listening to Africa and Harmonized Household Survey Project
Remittance Prices Worldwide (Sending Countries)
Provides data on the cost of sending and receiving relatively small amounts of money from one country to another. Data cover 365 country corridors worldwide, from 48 remittance sending countries to 105 receiving countries.
Remittance Prices Worldwide (Corridors)
Provides data on the cost of sending and receiving relatively small amounts of money from one country to another. Data cover 365 country corridors worldwide, from 48 remittance sending countries to 105 receiving countries.
Remittance Prices Worldwide (Receiving Countries)
Provides data on the cost of sending and receiving relatively small amounts of money from one country to another. Data cover 365 country corridors worldwide, from 48 remittance sending countries to 105 receiving countries.
PPPs Regulatory Quality: Procuring Infrastructure PPPs: Adherence to Best Regulatory Practices is a collection of comparable and actionable data on the procurement of large-scale public-private partnership (PPP) infrastructure projects around the world. The assessments of countries’ regulatory practices are organized in four thematic areas: preparation, procurement, contract management, and a special module on unsolicited proposals (USP).
Human Capital Index: This dataset is classified as Public under the Access to Information Classification Policy. Users inside and outside the Bank can access this dataset. The Human Capital Index (HCI) database provides data at the country level for each of the components of the Human Capital Index as well as for the overall index, disaggregated by gender. The index measures the amount of human capital that a child born today can expect to attain by age 18, given the risks to poor health and poor education that prevail in the country where the child lives. It is designed to highlight how improvements in current health and education outcomes shape the productivity of the next generation of workers, assuming that children born today experience over the next 18 years the educational opportunities and health risks that children in this age range currently face.
Worldwide Bureaucracy Indicators (WWBI)
Worldwide Bureaucracy Indicators (WWBI): A dataset on public sector employment and wages that can help researchers and development practitioners gain a better understanding of the personnel dimensions of state capability, the footprint of the public sector on the overall labor market, and the fiscal implications of the government wage bill.
Logistics Performance Index (LPI)
Logistics Performance Index (LPI) - Logistics comprises a network of services that supports the physical movement of goods within and across borders. It is a $4.3 trillion industry. The 2018 Logistics Performance Index (LPI) scores countries on how efficiently they move goods across and within borders. The LPI is an interactive benchmarking tool created to help countries identify the challenges and opportunities they face in their performance on trade logistics and what they can do to improve their performance. The LPI 2018 allows for comparisons across 160 countries.
Health Equity and Financial Protection Indicators (HEFPI)
Health Equity and Financial Protection Indicators (HEFPI) - The HEFPI database draws on data from over 1,600 household surveys, including the Demographic and Health Survey and the Multiple Indicator Cluster Survey. Most of the 1,600 surveys have been re-analyzed in-house to ensure comparability across surveys and years, since published indicators from different surveys often use different definitions. We have settled on a definition based on recommendations in the relevant literature, and have used that across all surveys and time periods. As a result, the numbers in HEFPI are often different from (and more comparable than) numbers published elsewhere. HEFPI provides data on equity in the delivery of health service interventions and health outcomes, and on financial protection in health.
Global Financial Inclusion and Consumer Protection Survey
Global Financial Inclusion and Consumer Protection Survey
Economic Fitness (EF) 2 is the second version of Economic Fitness, including the Universal Economic Fitness (UEF) which is both a measure of a country’s diversification and ability to produce complex goods on a globally competitive basis.
Environment Social and Governance (ESG) Data
Aggregate groups may reflect economies beyond those included in this database. For details on the member composition, see World Bank Country and Lending Groups
Results from the International Comparison Program (ICP) 2017 cycle include data for the new reference year 2017, revised data for the previous reference year 2011, and annual purchasing power parities (PPPs) for 2012 to 2016. 2017 results are available for 176 participating economies and their aggregate regions. They cover 44 expenditure headings and provide several indicators for each heading, including PPPs, national accounts expenditures in PPP and nominal terms, and price level indices. Imputed results are available for an additional 12 economies that did not participate in the ICP 2017 cycle. Revised 2011 results are available for 179 participating economies and cover 44 expenditure headings and several indicators, including PPPs, national accounts expenditures in PPP and nominal terms, and price level indices. Additionally, partial results are available for 20 Pacific islands, while imputed results are available for 15 economies that did not participate in the ICP 2011 cycle. Annual PPPs are available for 2011 to 2017 and cover 6 major expenditure headings.
Gender Disaggregated Labor Database (GDLD)
Gender Disaggregated Labor Database (GDLD)
International Debt Statistics: DSSI
IDS-DSSI is a supplemental database to the International Debt Statistics database and provides further disaggregation of external debt data including projected debt service payments for 2020 to 2022 presented on an annual and monthly basis where undrawn amounts are not projected.
Contains data about global procurement
Statistical Performance Indicators (SPI)
This dataset is classified as Public under the Access to Information Classification Policy. Users inside and outside the Bank can access this dataset.The Statistical Performance Indicators (SPI) is a framework to measure progress in statistical capacity building and related investments. It covers five aspects: data use, data services, data products, data sources, and data infrastructure.Countries will be given an opportunity to dispute the values that make up our indicators. The team takes every effort to make sure the data presented in the Statistical Performance Indicators are accurate, but it is possible that the sources we used to assign values for our indicators are occasionally not up to date or accurate despite these efforts. Because of this, countries will have a window to provide documentation for any disputed values through contacting the Bank directly or via [email protected].
Calendar
Forecast
Indicators
News
Blog
--> Markets
Currency
--> GDP
GDP
GDP Annual Growth Rate
GDP Constant Prices
GDP From Agriculture
GDP From Mining
GDP From Services
GDP per capita
GDP per capita PPP
Gross Fixed Capital Formation
--> Labour
Employed Persons
Population
Unemployment Rate
Youth Unemployment Rate
--> Prices
Consumer Price Index CPI
CPI Housing Utilities
CPI Transportation
Food Inflation
Inflation Rate
Inflation Rate Mom
Producer Prices
--> Money
Deposit Interest Rate
Interest Rate
--> Trade
Balance of Trade
Crude Oil Production
Current Account
Current Account to GDP
Exports
Exports by Category
Exports by Country
Foreign Direct Investment
Imports
Imports by Category
Imports by Country
Terrorism Index
Weapons Sales
--> Government
Credit Rating
Fiscal Expenditure
Government Budget
Government Budget Value
Government Debt to GDP
Government Revenues
Government Spending
Holidays
Military Expenditure
--> Business
Car Production
Competitiveness Index
Competitiveness Rank
Corruption Index
Corruption Rank
Ease of Doing Business
Industrial Production
Internet Speed
IP Addresses
Steel Production
--> Consumer
Consumer Spending
--> Taxes
Sales Tax Rate
--> Climate
Precipitation
Temperature
Internet Resources for Data Analysis
Data & Statistics | Queen's University Library
Statistics - Research Process - LibGuides at Northcentral University
Quantitative Data: Numerical data.
Data Analytics: A scientific and systematic approach to examine raw data in order to draw valid conclusions about them. Data are extracted and structured, and qualitative and quantitative techniques are used to identify and analyze patterns.
Evidence-Based Practice: Integrating expert opinion, external scientific evidence, and client values in daily service and decision making.
Altmetrics: Alternative metrics; non-traditional ways to measure the impact of a scholarly work.
Web Analytics: The process of analyzing the behavior of visitors to a Web site.
Variable: Factor (e.g., staff, hours of operation, circulation of materials, number of computers).
Internet of Things: Internet property that enables objects have network connectivity, which allows them to send and receive data.
Qualitative Data: Non-numerical data (e.g., interviews, videos, artifacts).
Geographic Information System: An electronic tool used to store, view, and analyze geographical and statistical information
Statistical Resources on the Web >> globalEDGE: Your source for Global Business Knowledge
Statistical Resources - Reference Resources - Library at Carroll Community College
Statistical Resources on the Web/Education
Statistical Resources on the Web >> globalEDGE: Your source for Global Business Knowledge
Statistical resources: Data & statistics information | SFU Library
Category:Databases by subject - Wikipedia
Statistical database - Wikipedia
Internet Resources for Data Analysis
Social media mining - Wikipedia
Social network analysis - Wikipedia
United States Total Gross External Debt | 2003-2021 Data | 2022-2023 Forecast
Iran External Debt | 1993-2020 Data | 2021-2023 Forecast | Historical | Chart | News
Major foreign holders of U.S. treasury securities 2021 | Statista
ALICE Catalog | Ohio University Libraries (Databases Search)
https://databank.worldbank.org/databases/page/7
Statistics - Research Process - LibGuides at Northcentral University
World Development Indicators | DataBank
Национален статистически институт
Economic Indicators | Moody's Analytics
Consumer price indices (CPIs) - Complete database
Corruption Perceptions Index - Dataset - DataHub - Frictionless Data
Global Terrorism Index 2018 | Measuring the impact of global terrorism
Standard Industrial Classification
PEST and SWOT Analysis for Business Industry & Competitive Analysis
International Standard Industrial Classification
Global Industry Classification Standard
سامانه جامع اولویتهای پژوهشی کشور پنجرهای واحد به همه اولویتهای پژوهشی و تحقیقاتی کشور در همه رشتههای دانشگاهی
Russia IT spending forecast 2015-2016 | Statistic
Global IT hardware spending forecast 2013-2019 | Statistic
Прошло много времени с тех пор, как - Перевод на английский - примеры русский | Reverso Context
IT spending worldwide forecast 2015-2020 | Statistic
Predictive Analysis | Intelligent Analysis | Strategic Market Research | Strategy Analytics
NinjaTrader Version 7
Build Cheat Sheets and Share Your Favourites! - Cheatography.com: Cheat Sheets For Every Occasion
Outline of industry
The Russian Computer Association
strategic analysis industry environment
World Watch List | Countries Where Christianity is Illegal | Open Doors
INDUSTRY ENVIRONMENT ANALYSIS
https://analytics.google.com/analytics/web/provision/?authuser=0#provision/CreateAccount/
Arts and Entertainment
Automotive
Beauty and Fitness
Books and Literature
Business and Industrial Markets
Computers and Electronics
Finance
Food and Drink
Games
Healthcare
Hobbies and Leisure
Home and Garden
Internet and Telecom
Jobs and Education
Law and Government
News
Online Communities
People and Society
Pets and Animals
Real Estate
Reference
Science
Shopping
Sports
Travel
Other
---
Operations in countries 2Health systems 10Communicable diseases 18Noncommunicable diseases 29Environment and health 37Health intelligence and publishing for public health 43Infrastructure and logistics 51Administrative services 53Governanc
-----
Impact of Circular Migration on Human, Political and Civil Rights. AGlobal PerspectiveSole
Global and Regional Leadership of BRICS Countries.
State Fragility and State Building in Africa: Cases from Eastern andSouthern Africa
The Effects of Europeanization on the Integration Process in the UpperAdriatic Region
Importing EU Norms: Conceptual Framework and Empirical Findings.Bj
Intersecting Interregionalism.Regions, Global Governance and the EU.Baert, Francis, Scaramagli, Tiziana,
Regionalizing Oman: Political, Economic and Social Dynamics
State, Globalization and Multilateralism: The challenges of institutional-izing regionalism.Telo
The Rise of Post-Hegemonic Regionalism: The Case of Latin America
Global Gaming Market
Video game industry - Statistics & Facts
Entertainment Software Association - ESA
List of highest-grossing films
List of best-selling video games
DSS MIS | Decision Support Systems
Decision Support Systems - What is it? Definition, Examples and More
PPT - Chapter 10 Decision Support Systems PowerPoint Presentation, free download - ID:4381619
Decision support system for integrated pest management in the vineyard
سیستم پشتیبانی تصمیم (DSS) و انواع آن - بهینگی
Decision Support System (DSS) Proposal for The Grange
Decision Support Systems and Business Intelligence Learning
Decision support system for integrated pest management in the vineyard
Decision support system for integrated pest management in the vineyard
مقالات ISI سیستمهای پشتیبان تصمیم : 184 مقاله انگلیسی + ترجمه فارسی
سیستم پشتیبانی تصمیم گیری - Поиск в Google
DSS چیست؟ - فراتحلیلگران ورجاوند
شناسایی و تبیین عوامل کلیدی موثر بر حوزه سیستمهای اطلاعاتی مدیریت
کاربرد سیستمهای پشتیبان تصمیم در تصمیم گیری مدیران
سیستم پشتیبانی تصمیم (DSS) و انواع آن - بهینگی
olap site:fadak.ir - Поиск в Google
AI Decision Support Systems - IRIS
DSS: Decision Support Systems and AI: Artificial Intelligence - ppt video online download
AI-powered decision support systems, what are they? | THE BLOG
Intelligent decision support system - Wikipedia
DSS: Decision Support Systems and AI: Artificial Intelligence - ppt video online download
I found this one for MAC:-
http://www.truenorthsoftware.com/ahpdecision/
This one is a simple and nice one on-line:-
http://www.transparentchoice.com/
I have also developed an open-source free tool (for Windows, Linux and Android):-
https://sourceforge.net/projects/priority/
Also see a list on wiki: https://en.wikipedia.org/wiki/Decision-making_software
R has a nice AHP package. You can use it with any GUI like R Studio or Rcommander
Check: https://bpmsg.com/tag/ahp-free-software/
Seminar (Excel & AHP)
http://giswin.geo.tsukuba.ac.jp/sis/gis_seminar/How%20to%20do%20AHP%20analysis%20in%20Excel.pdf
Priority Estimation Tool (AHP) download | SourceForge.net
Decision-making software - Wikipedia
Analytic Hierarchy Process - (ahp software)
Are there any source of downloading free AHP software?
دانلود نرم افزار Super Decisions تحلیل فرآیندهای شبکهای و سلسله مراتبی
Analytic Hierarchy Process - (ahp software)
BPMSG – Business Performance Management Singapore
دانلود نرم افزار Super Decisions تحلیل فرآیندهای شبکهای و سلسله مراتبی
دانلود نرم افزار سوپر دسیژن (super decision) | صنایع بیست
دانلود نرم افزار سوپر دسیژن Super decision | پایگاه امین آرتیکل
Multi Criteria Decision Making
Five Decision Support System Examples You Need to Know
Releases · czekster/Decisor · GitHub
Software for Strategy Management - Intrafocus
Strategic Planning & Management Software | Envisio
The Top 8 Free, Open Source ERP Software - Capterra Blog
Comparison of project management software
dss decision support system free download - SourceForge
5+ Decision Support Software Free and Open Source - Butler Analytics
dss decision support system free download - SourceForge
Big Data vs Data Warehouse - Find Out The Best Differences
فایلهای این سایت را دانلود شود چون پولی است
Analytics
Application Performance
Applications Suite
Audit Software
Big Data Software
Business Continuity Software
Business Intelligence
Business Performance
Competitive Intelligence
Dashboard Software
Data Management Software
Data Mapping Software
Data Visualization
Data Warehousing
Decision Support Software
Physical Security
Predictive Analytics
Reporting Software
Statistical Analysis
Strategy Execution
-----------------------------------------------
Top Business Intelligence Reviews 2018
Top 10 free and open source business intelligence software
16 Free and Open Source Business Intelligence Tools - Logz.io
Best Decision Support Software | 2018 Reviews of the Most Popular Systems
GitHub - treeio/treeio: Tree.io